Productivity
Alien Art Charts
Free Animated Chart Maker (Bar Chart Race & More)
- Category
- Productivity
- Stage
- Growth
- For
- Creators, marketers, agencies, and teams making animated data-visualization videos from spreadsheet data.
About
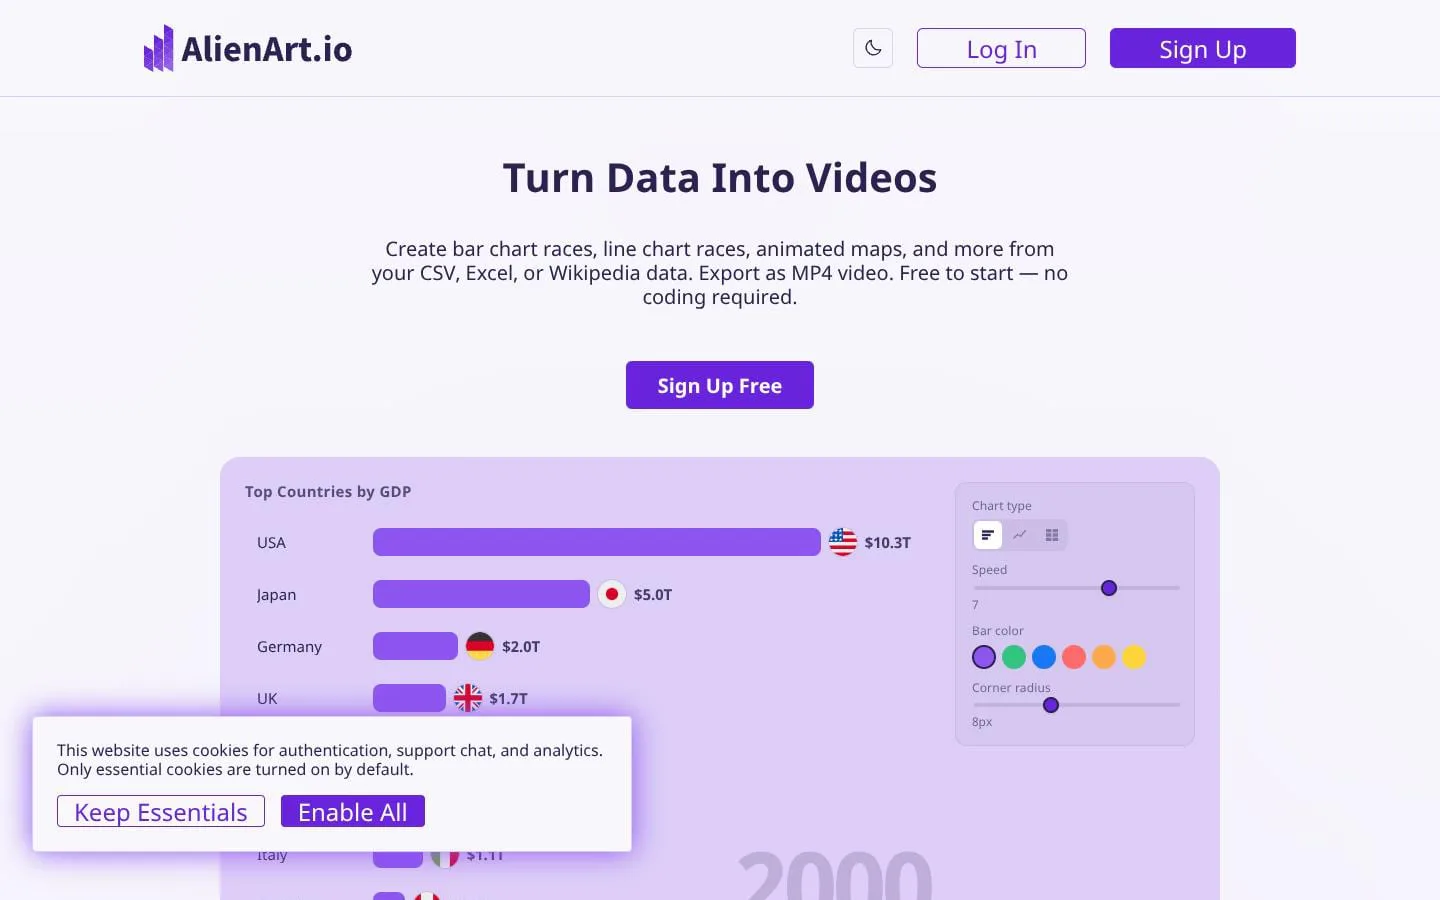
Online tool that turns spreadsheet data into animated chart videos. Create bar chart races, line chart races, animated maps, comparison charts, and more — export as MP4, WebM, or transparent WebP.
Features
- Problem
- Raw spreadsheet data is not inherently engaging video content.
- How it works
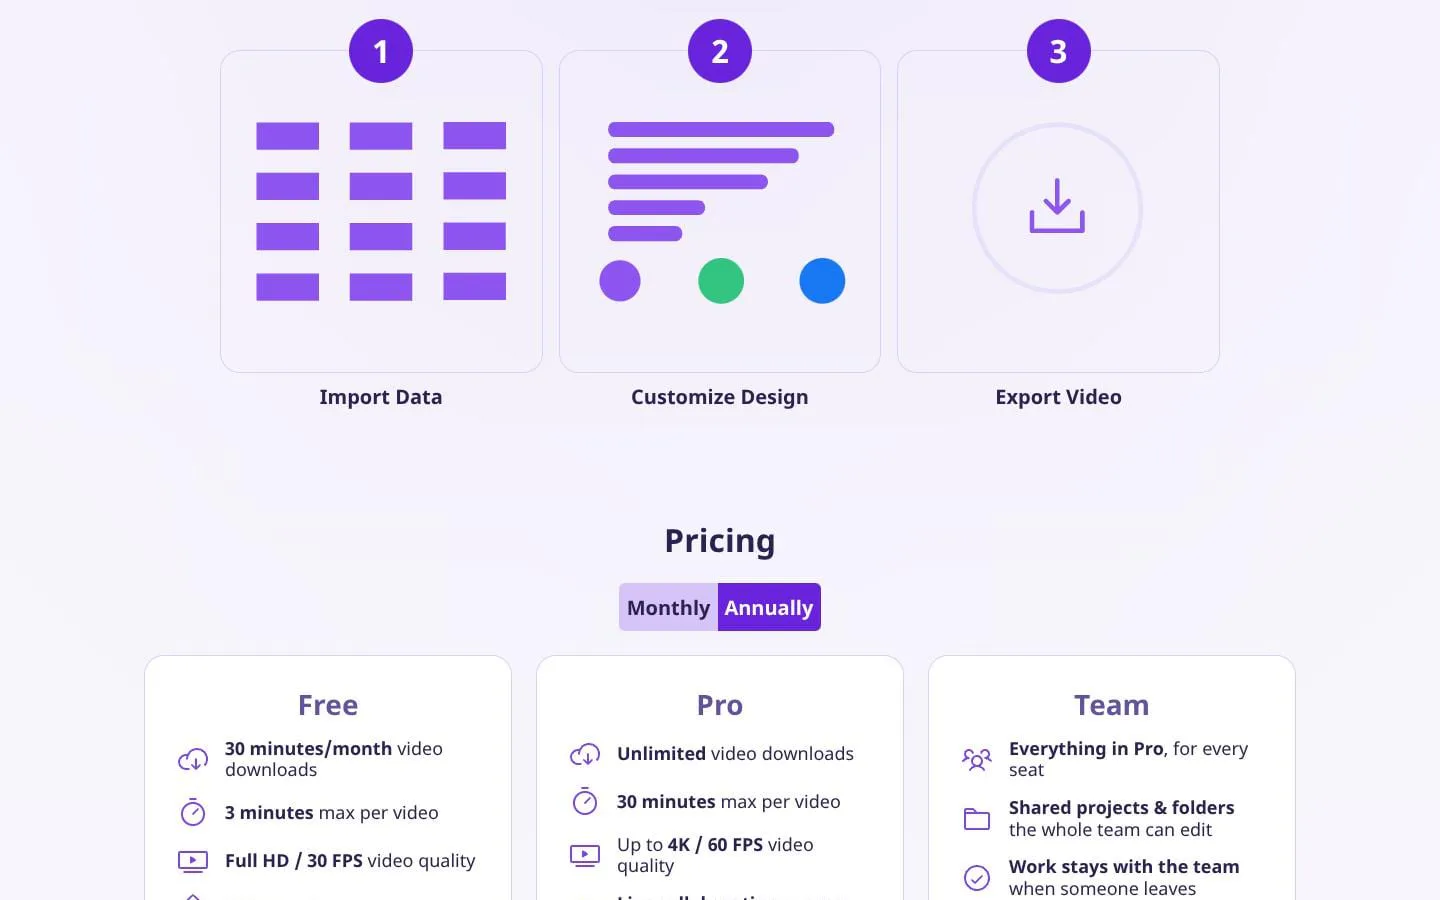
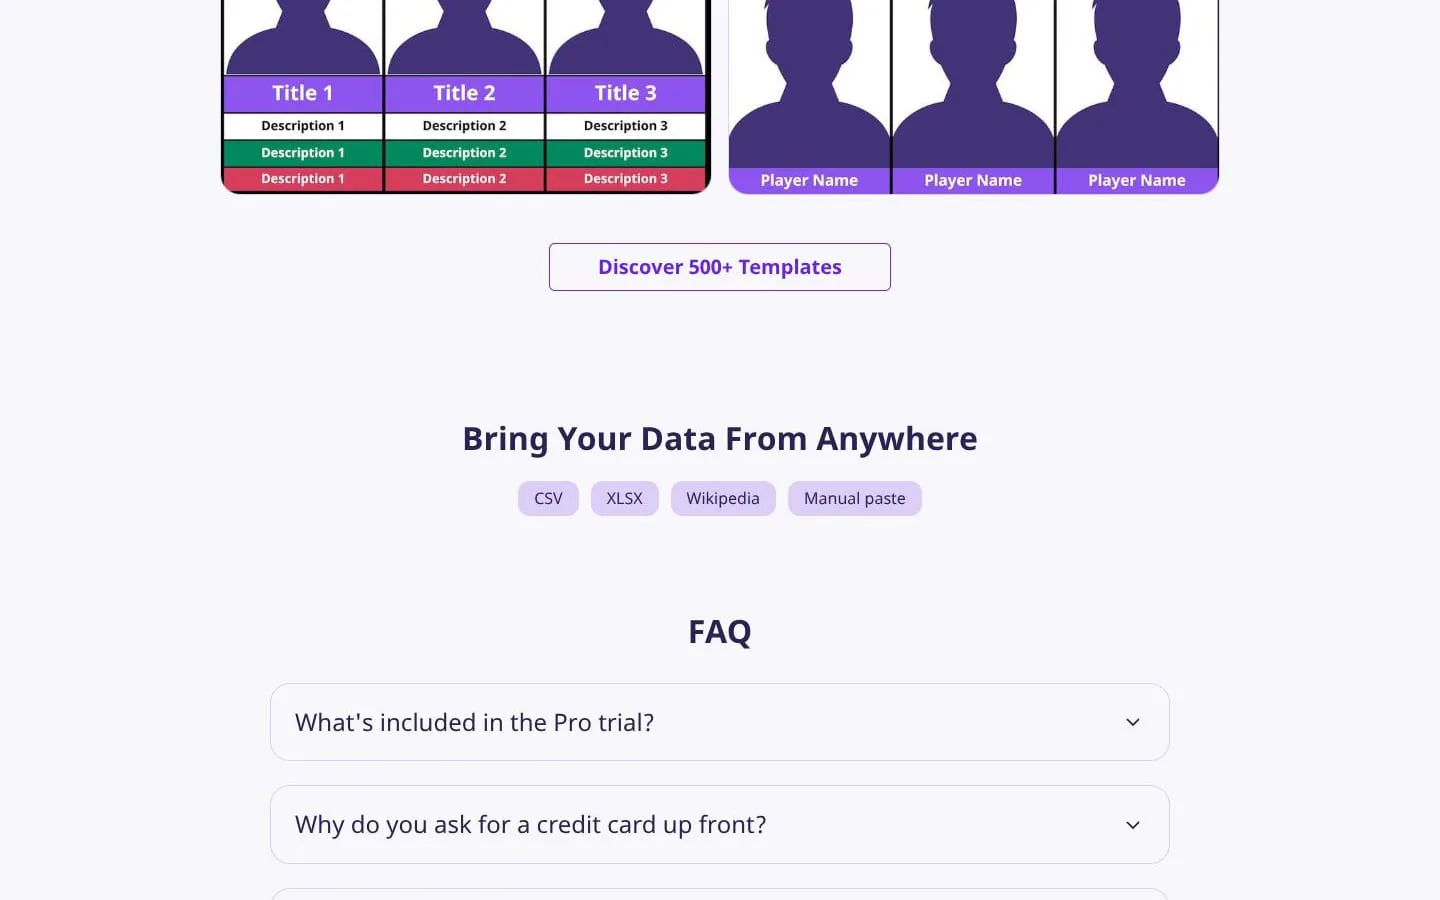
- Imports CSV and XLSX data, accepts Wikipedia tables and manual pastes, and offers curated datasets such as YouTube channels, GDP, population, cryptocurrencies, and more.
- Result
- Data can move from source to an editable chart project quickly.
- Why
- Gives creators multiple ways to begin a visualization without having to build a dataset from scratch.
- Problem
- A single chart format does not suit every data story.
- How it works
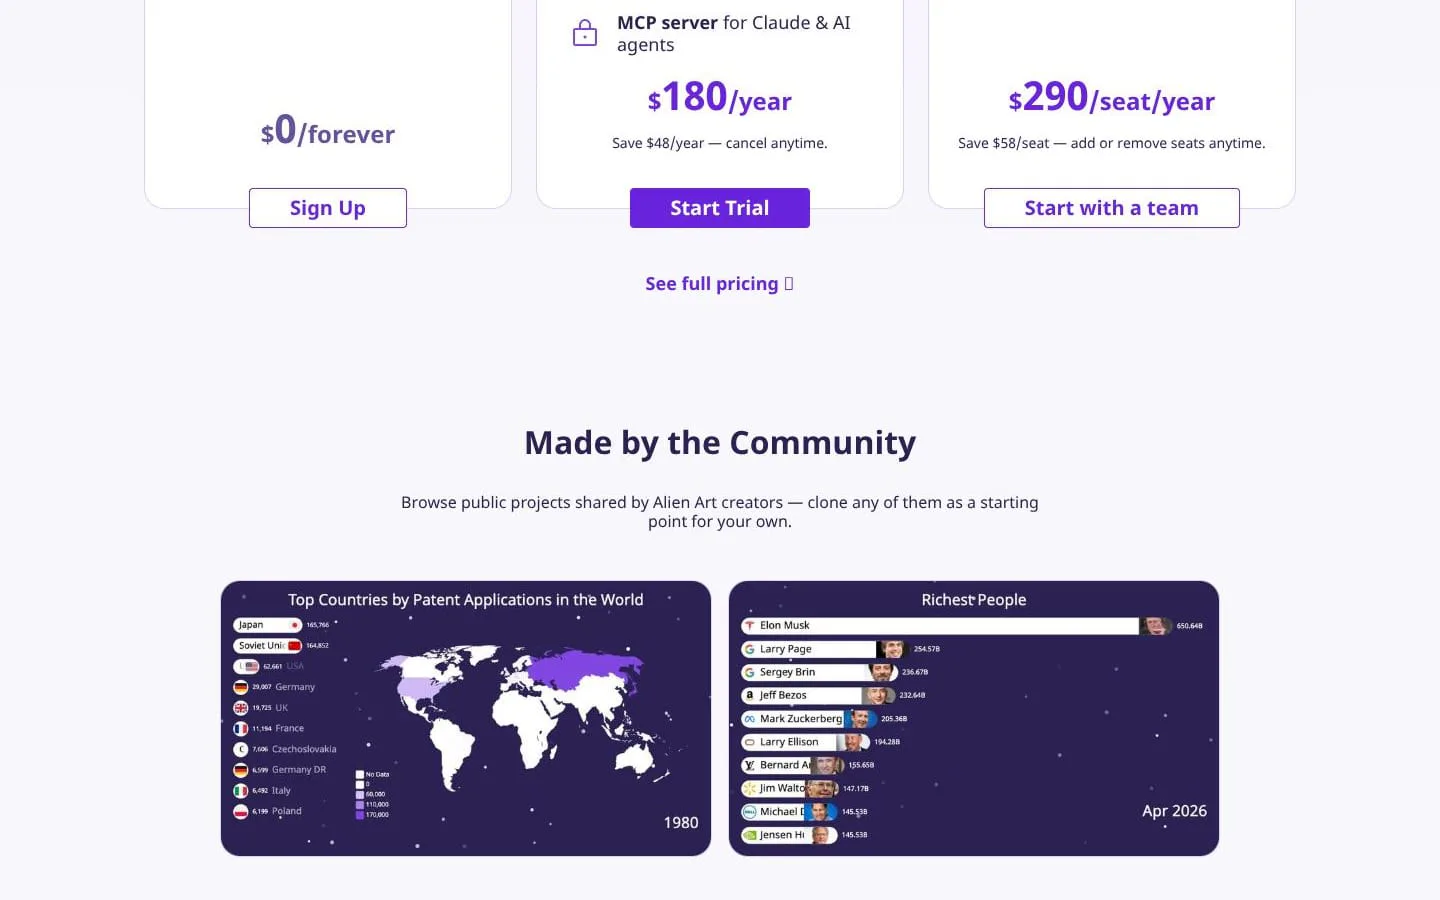
- Supports animated bar, table, map, line, tornado, bubble, pie, treemap, and comparison formats, plus slideshows and static infographics.
- Result
- Users can select a visual format that fits their data and message.
- Why
- Different stories require rankings, trends, geographic views, compositions, or side-by-side comparisons.
- Problem
- Default charts rarely match a creator’s visual identity.
- How it works
- Provides design controls and layers for titles, images, video clips, captions, logos, flags, totals, backgrounds, animation effects, narration, and audio visualization.
- Result
- Creators can produce more tailored, presentation-ready visual stories.
- Why
- Video-ready charts need branded context and visual emphasis beyond plotted data.
- Problem
- Rendering and distribution can require separate tools.
- How it works
- Exports MP4 video on all plans, with Pro supporting up to 4K/60 FPS plus WebM and WebP; the MCP can also render PNG, JPEG, WebP, and hosted iframe outputs.
- Result
- Finished visuals can be prepared for social video, client work, documents, or embeds.
- Why
- Different publishing channels and workflows require different file and embed formats.
- Problem
- Teams risk losing project continuity and rebuilding assets repeatedly.
- How it works
- Offers shared projects and folders, pooled team workspaces, brand settings, editable templates, and live collaboration on Pro projects.
- Result
- Teams can standardize production and retain access when members change.
- Why
- Collaborative production needs shared ownership and reusable starting points.
- Problem
- Building charts manually remains repetitive for AI-assisted workflows.
- How it works
- Offers an OAuth-connected Model Context Protocol server that lets compatible AI clients create projects, upload or update spreadsheets, add layers and elements, and start renders.
- Result
- Pro users can create, revise, and render animated charts from supported AI clients.
- Why
- AI assistants can translate prompts and supplied data into editable chart projects.
Screenshots